Statistics
Trade Execution Quality Statistics Information
Price Improvement
How it's measured: Percentage of shares executed at prices better than the prevailing National Best Bid or Offer (NBBO), i.e., either below the best offer for buys or above the best bid for sells.
| Month | Overall Listed | Overall NASDAQ |
|---|---|---|
| December 2025 | 95.5% | 94.3% |
| November 2025 | 92.6% |
92.1% |
| October 2025 | 95.8% | 94.9% |
| September 2025 | 97.7% | 96.2% |
| August 2025 | 97.7% | 96.1% |
| July 2025 | 97.7% | 96.1% |
Executions represent SEC Rule 605 eligible market orders between 100-1,999 shares executed as agent through third-party market makers and listed exchanges and as principal by NFS-affiliated desks. Analysis includes only those exchanges or market makers receiving at least 2% of Fidelity Brokerage Services, LLC monthly Nasdaq and Listed share volume.
Source: TTA (Thomson Transaction Analytics)
System availability and response times may be subject to market conditions.
Execution Price
How it's measured: Percentage of shares executed at or within the National Best Bid or Offer (NBBO), which is a consolidated quote representing the highest bid and lowest offer for a security across all exchanges and/or market makers. It is updated continuously during market hours.
| Month | Overall Listed | Overall NASDAQ |
|---|---|---|
| December 2025 | 99.4% | 98.5% |
| November 2025 |
99.2% |
98.0% |
| October 2025 | 99.3% | 98.6% |
| September 2025 | 99.5% |
98.7% |
| August 2025 | 99.5% | 98.8% |
| July 2025 | 995% | 98.9% |
Executions represent SEC Rule 605 eligible market orders between 100-1,999 shares executed as agent through third-party market makers and listed exchanges and as principal by NFS-affiliated desks. Analysis includes only those exchanges or market makers receiving at least 2% of Fidelity Brokerage Services, LLC monthly Nasdaq and Listed share volume.
Source: TTA (Thomson Transaction Analytics)
System availability and response times may be subject to market conditions.
Execution Speed
How it's measured: Average period between the time Fidelity receives an order and the time of order execution.
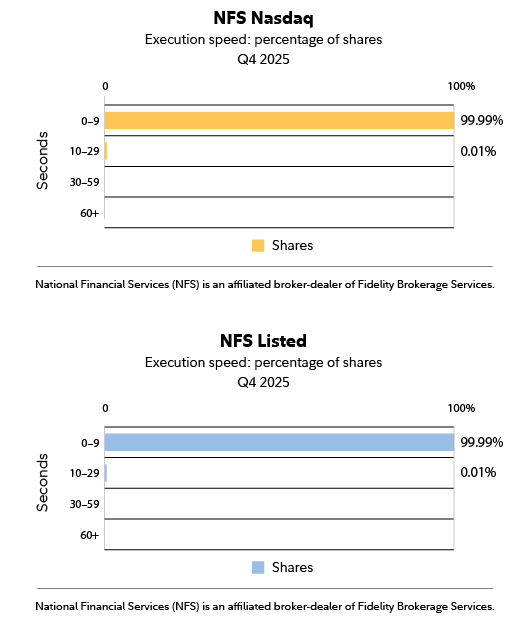
Executions represent SEC Rule 605 eligible market orders between 100-1,999 shares executed as agent through third-party market makers and listed exchanges and as principal by NFS-affiliated desks. Analysis includes only those exchanges or market makers receiving at least 2% of Fidelity Brokerage Services, LLC monthly Nasdaq and Listed share volume.
Source: TTA (Thomson Transaction Analytics)
System availability and response times may be subject to market conditions.
Effective Spread
How it's measured: The distance from the midpoint of the market at the time when your order is entered to the execution price you receive. This value is doubled to capture the whole bid/offer spread. This amount captures both how often, and by how much, a broker-dealer improves the price of a share.
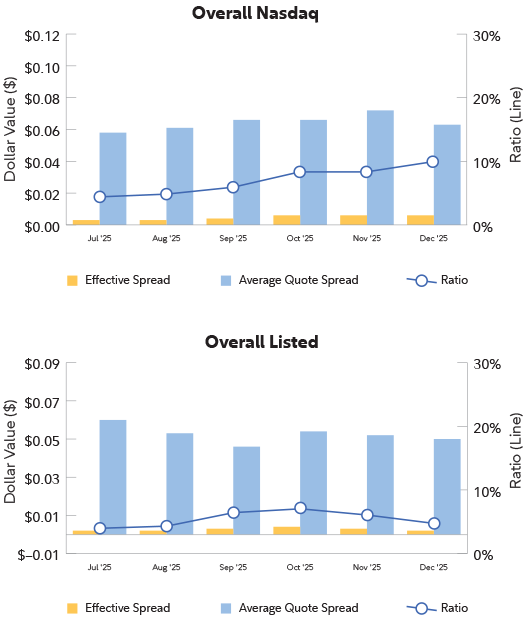
Executions represent SEC Rule 605 eligible market orders between 100-1,999 shares executed as agent through third-party market makers and listed exchanges and as principal by NFS-affiliated desks. Analysis includes only those exchanges or market makers receiving at least 2% of Fidelity Brokerage Services, LLC monthly Nasdaq and Listed share volume.
Source: TTA (Thomson Transaction Analytics)
What is Effective Spread
Effective Spread measures the distance from the midpoint of the market at the time when your order is entered to the execution price you receive. This value is doubled to capture the whole bid/offer spread.
For example:
A stock is quoted with a bid of $10.00 and an ask of $10.04 at the time your order is entered. The quoted spread is $0.04. The midpoint price is $10.02 and your buy order is executed at $10.03. The difference between the midpoint ($10.02) and your execution price ($10.03) is $.01. This value is doubled, so the effective spread on your order is $.02. The lower the effective spread value, the better.

Effective Spread calculates how much above the midpoint price you paid on a buy order and how much below the midpoint price you received on a sell order.
Executions represent SEC Rule 605 eligible market orders between 100-1,999 shares executed as agent through third-party market makers and listed exchanges and as principal by NFS-affiliated desks. Analysis includes only those exchanges or market makers receiving at least 2% of Fidelity Brokerage Services, LLC monthly Nasdaq and Listed share volume.
Source: TTA (Thomson Transaction Analytics)